This text is part of the Weather Preparedness & Resilience Toolbox developed by the YOUROPE Event Safety (YES) Group within YOUROPE’s 3F project (Future-Fit Festivals). It is aimed at everyone involved in planning, building, and operating open-air events. It helps festivals and other outdoor events become truly weather-ready by offering both practical and research-based resources as well as background information on weather and climate. Learn how to design safer and more weather-resilient outdoor events.
Weather Toolbox – Combined Weather Hazard Dashboard
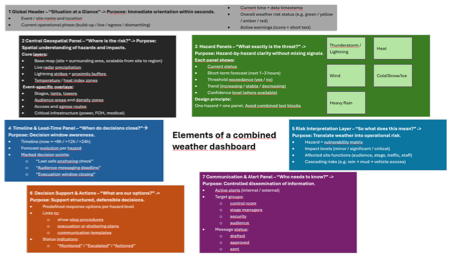
What Is a Combined Weather Hazard Dashboard?
A combined weather hazard dashboard is an integrated, decision-support interface that aggregates, contextualizes, and visualizes multiple weather-related hazards within a single, coherent operational view. Its primary function is not merely to display meteorological data, but to translate weather intelligence into actionable risk information for time-critical decision-making.
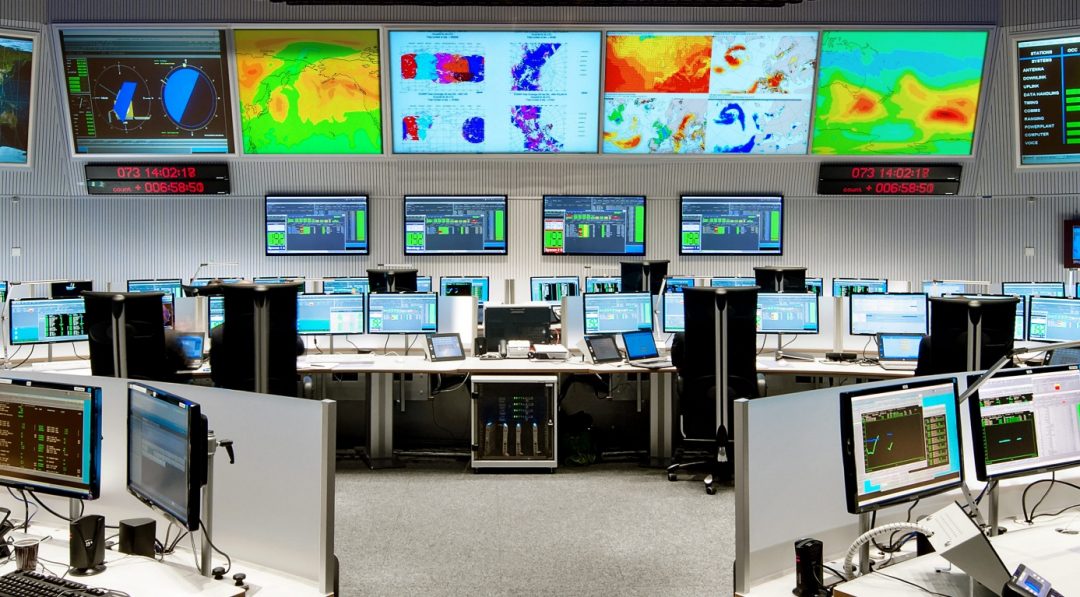
It does not have to be this big: make sure to create a set-up that fits to your needs (information, knowledge, staff, resources)
In contrast to single-hazard or purely meteorological tools, a combined dashboard is explicitly multi-hazard, multi-source, and multi-layered. It supports the full risk-management cycle from situational awareness and early warning through operational response and post-event analysis.
Functional Purpose in an Operational Context
A combined weather hazard dashboard serves four interlinked purposes:
- Situational Awareness
Provide a real-time overview of all relevant weather hazards affecting a defined area or event site. - Anticipation and Lead Time
Integrate forecasts, nowcasting products, and thresholds to highlight what may happen next and when decision windows will close. - Risk Interpretation
Link meteorological parameters (e.g. wind speed, rainfall intensity) to operational consequences (e.g. stage stability, ground saturation, heat stress). - Decision Support and Documentation
Support go/no-go decisions, escalation, show-stop procedures, and provide traceable documentation for duty-of-care and liability purposes.
Important: make sure that you have the knowledge to deal with the data. Only because you can see the information does not necessarily mean that you are able to interpret them.
Appoint an expert (for example as commercial service) if necessary.
Recommended Information Layers for a Combined Weather Hazard Dashboard
Meteorological Core Data
- precipitation (intensity, accumulation, movement)
- wind (mean, gusts, direction, vertical profiles)
- temperature, heat index,
- lightning activity and trends
- visibility (fog, heavy rain)
Hazard-Specific Indicators
- thunderstorm severity indices
- flood and flash-flood warnings
- soil moisture and ground saturation
- heat stress categories
- cold and snow thresholds
Event-Specific and Operational Layers
- site layout and infrastructure
- crowd density and critical zones
- access and egress routes
- emergency assembly points
- shelter and refuge capacities
Decision-Support Elements
- escalation thresholds and triggers
- links to show-stop or evacuation procedures
- timeline view of forecast evolution
- uncertainty indicators and confidence levels
Typical Data Sources to Integrate
A robust dashboard normally combines:
- National meteorological services
Authoritative warnings, radar, official forecasts. - Specialized private providers
High-resolution nowcasting, lightning networks, tailored forecasts. - On-site instrumentation
Anemometers, rain gauges, temperature and heat sensors. - On-site information
audience behaviour, mood, number of attendees, crowd flow - Infrastructure catalogue
List of all buildings and structures with information on location, owner and requirements
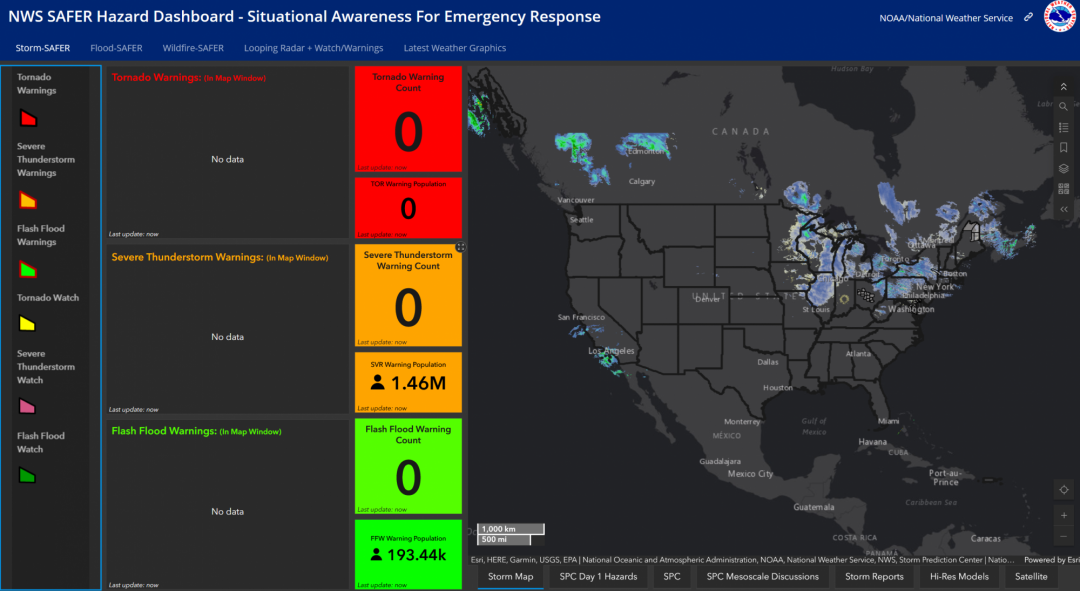
NWS SAFER Hazard Dashboard – Situational Awareness For Emergency Response
https://noaa.maps.arcgis.com/apps/MapSeries/index.html?appid=ea8b0eeb2e9c45b790329c0ed2fdc225
USE CASE: Dashboard Information Architecture (Control Room Integration)
A combined weather hazard dashboard should follow a clear operational hierarchy:
What is happening now → What will happen next → What does it mean → What do we do?
PRACTICAL EXAMPLE
1 GLOBAL HEADER – Situation at a Glance
Event: New Year’s Open-Air Festival – Rheinaue, Bonn
Operational Phase: Live
Current Time: 30 Dec 2025, 14:30 CET (Updated: 14:25)
Overall Weather Risk Status: AMBER – Elevated risk, active monitoring required
⚠️ Active Warnings:
- 🌬️ Wind Gust Warning (up to 85 km/h)
- 🌧️ Heavy Rain Alert (25mm/3h)
- 🌊 Flood Pre-Warning (Rhine River Pathway)
✅ Key Message: Risk is elevated. Storm cells approaching from the southwest. Wind and surface water impacts likely within next 2–3 hours.
2 CENTRAL GEOSPATIAL PANEL – Where is the risk?
| Layer | Status | Notes |
| 🗺️ Base Map | ✅ ON | Rheinaue park, access roads, Rhine proximity |
| 🌧️ Live Radar Precipitation | ✅ ON | Rain bands approaching from SW, ETA 15:30 |
| ⚡ Lightning + 10km buffer | ✅ ON | Storm cells 20km away, increasing strikes |
| 💨 Wind Gust Footprints | ✅ ON | Peak gusts 70–85 km/h within next 2h |
| 🌡️ Heat Index | ❌ OFF | Not relevant (Temp: 6°C) |
| 🌊 Flood/Surface Water | ✅ ON | Ponding risk on access paths |
| 🎪 Event Overlays | ✅ ON | Stage, FOH, emergency exits, power nodes |
| 🚶 Audience Zones | ✅ ON | Moderate density in lawn area |
| 🚑 Critical Infra | ✅ ON | Medical, FOH, comms mast, power generators |
3 HAZARD PANELS – What exactly is the threat?
1. 🌩️ Thunderstorm / Lightning
- Current Status: No strikes <10km
- Forecast (1–3h): Isolated cells approach by 16:00
- Threshold Exceeded: ❌
- Trend: Increasing ⚠️
- Confidence: Medium
2. 💨 Wind
- Current Status: Gusts up to 65 km/h observed
- Forecast (1–3h): Peak 85 km/h between 15:30–16:30
- Threshold Exceeded: ✅ (Gust > 70 km/h)
- Trend: Increasing 🔺
- Confidence: High
3. 🌧️ Heavy Rain / Flooding
- Current Status: Light to moderate rain
- Forecast (1–3h): 20–25 mm expected by 17:00
- Threshold Exceeded: ✅ (>20mm/3h)
- Trend: Increasing 🔺
- Confidence: Medium–High
4. 🌡️ Heat
- Status: Not applicable
- Temperature: 6°C
5. ❄️ Cold / Ice
- Status: Low risk overnight
- Forecast: Temps down to 1°C by 21:00
- Threshold Exceeded: ❌
- Confidence: Medium
6. 🌫️ Visibility (Fog / Rain)
- Current Status: Rain-reduced visibility (~600m)
- Trend: Stable
- Impact: Minor delays for transport logistics
4 TIMELINE & LEAD-TIME PANEL – When do decisions close?
Timeline: Now → +6 Hours (14:30–20:30 CET)
| Time | Wind Gusts | Rainfall | Storm Proximity | Actions |
| 14:30 | 65 km/h | Moderate | 20km | — |
| 15:30 | 80–85 km/h | Heavy (15mm/hr) | 10km | ✅ Last safe anchoring check |
| 16:00 | Peak gusts | Sustained rain | Lightning <10km | ⚠️ Audience messaging deadline |
| 17:00 | 60 km/h | Easing | Cell passage | ✅ Evacuation window closes |
| 18:00 | 45 km/h | Light showers | Clear | — |
| 19:30 | 30 km/h | Dry | — | ✅ Re-entry possible |
5 RISK INTERPRETATION LAYER – So what does this mean?
Hazard × Vulnerability Matrix (Simplified)
| Hazard | Impact Level | Affected Functions | Cascading Risks |
| Wind | Critical 🔴 | Stage structures, FOH, signage | Collapse risk, flying debris |
| Rain | Significant 🟠 | Audience zones, access paths | Surface flooding, vehicle bogging |
| Thunderstorm | Moderate 🟡 | Outdoor audience, FOH crew | Lightning proximity, power cut |
| Cold | Minor | Staff comfort after sunset | Hypothermia risk if wet + windy |
🧩 Cascading Scenario: Heavy rain → saturated lawn → vehicle stuck during egress → delayed emergency access
6 DECISION SUPPORT & ACTIONS – What are our options?
| Hazard | Risk Level | Response Action | Status |
| Wind | High | Halt stage activity if >75 km/h | ⚠️ Escalated |
| Rain | Moderate | Activate drainage pumps | ✅ Actioned |
| Storm | Medium | Lightning monitor + shelter plan | 🟡 Monitored |
| Flood | Moderate | Redirect audience from river path | 🟡 Monitored |
📁 Links:
- 📜 Show-stop protocol
- 🧭 Evacuation route plan
- 📨 Audience Message template
📝 Decision Log Example:
- 14:00 – Gusts >70 km/h forecast – Escalated – Safety Lead
- 14:20 – Drainage system activated – Actioned – Ops Lead
7 COMMUNICATION & ALERT PANEL – Who needs to know?
| Target Group | Message | Status |
| 🎧 Stage Managers | “High wind risk: Secure equipment” | ✅ Sent 14:10 |
| 🚨 Control Room | “Gusts exceeding threshold in 60min” | ✅ Sent 14:15 |
| 🧍 Audience | “Rain and wind expected – seek shelter if directed” | 🟡 Drafted |
| 🚓 Security | “River path closed due to flooding” | ✅ Sent 14:20 |
📢 Next Message Draft:
“Lightning within 10km expected by 16:00 – ready shelter areas” → Approval pending